Debugging with VS Code?

permal
Posts: 384
Joined: Sun May 14, 2017 5:36 pm

Debugging with VS Code?

Postby permal » Sat Feb 09, 2019 4:33 pm

Hi,

Anyone here who has managed to get debugging working with VS Code?

I've gotten as far as a debug session is started, but I can't get stepping etc. to work.

My setup so far (based off the official docs for JTAG debugging):

Running OpenOCD:

Code: Select all

bin/openocd -s share/openocd/scripts -f interface/ftdi/esp32_devkitj_v1.cfg -f board/esp32-wrover.cfg
VSCode debug config:

Code: Select all

{
            "name": "(xtensa-esp32-elf-gdb) Launch",
            "type": "cppdbg",
            "request": "launch",
            "program": "/home/permal/esp/xtensa-esp32-elf/bin/xtensa-esp32-elf-gdb",
            "args": ["-x", "${workspaceFolder}/gdbinit", "${workspaceFolder}/build/g3"],
            "stopAtEntry": false,
            "cwd": "${workspaceFolder}",
            "environment": [],
            "externalConsole": true,
            "MIMode": "gdb",
            "setupCommands": [
                {
                    "description": "Enable pretty-printing for gdb",
                    "text": "-enable-pretty-printing",
                    "ignoreFailures": true
                }
            ]
        }
When starting debugging the above results in this:
GNU gdb (crosstool-NG crosstool-ng-1.22.0-80-g6c4433a) 7.10
Copyright (C) 2015 Free Software Foundation, Inc.
License GPLv3+: GNU GPL version 3 or later <http://gnu.org/licenses/gpl.html>
This is free software: you are free to change and redistribute it.
There is NO WARRANTY, to the extent permitted by law. Type "show copying"
and "show warranty" for details.
This GDB was configured as "--host=x86_64-build_pc-linux-gnu --target=xtensa-esp32-elf".
Type "show configuration" for configuration details.
For bug reporting instructions, please see:
<http://www.gnu.org/software/gdb/bugs/>.
Find the GDB manual and other documentation resources online at:
<http://www.gnu.org/software/gdb/documentation/>.
For help, type "help".
Type "apropos word" to search for commands related to "word"...
Reading symbols from /home/permal/electronics/IO-Card-G3/software/build/g3...done.
0x401c5ec5 in get_time_since_boot ()
at /home/permal/esp/esp-idf/components/newlib/time.c:282
282 microseconds = s_microseconds_offset + esp_timer_get_time();
JTAG tap: esp32.cpu0 tap/device found: 0x120034e5 (mfg: 0x272 (Tensilica), part: 0x2003, ver: 0x1)
JTAG tap: esp32.cpu1 tap/device found: 0x120034e5 (mfg: 0x272 (Tensilica), part: 0x2003, ver: 0x1)
esp32: Debug controller 0 was reset (pwrstat=0x5F, after clear 0x0F).
esp32: Core 0 was reset (pwrstat=0x5F, after clear 0x0F).
Target halted. PRO_CPU: PC=0x5000004B (active) APP_CPU: PC=0x00000000
esp32: Core 0 was reset (pwrstat=0x1F, after clear 0x0F).
esp32: Debug controller 1 was reset (pwrstat=0x5F, after clear 0x0F).
esp32: Core 1 was reset (pwrstat=0x5F, after clear 0x0F).
Target halted. PRO_CPU: PC=0x40000400 (active) APP_CPU: PC=0x40000400
Hardware assisted breakpoint 1 at 0x400d7b94: file /home/permal/electronics/IO-Card-G3/software/main/main.cpp, line 4.
Target halted. PRO_CPU: PC=0x400D7B94 (active) APP_CPU: PC=0x401D40C2
[New Thread 1073478312]
[New Thread 1073476412]
[New Thread 1073480968]
[New Thread 1073460516]
[New Thread 1073412860]
[New Thread 1073459128]
[New Thread 1073462620]
[Switching to Thread 1073474380]

Temporary breakpoint 1, app_main ()
---Type <return> to continue, or q <return> to quit---
Pressing <return> correctly results in the app stopping at app_main():
[New Thread 1073459128]
[New Thread 1073462620]
[Switching to Thread 1073474380]

Temporary breakpoint 1, app_main ()
---Type <return> to continue, or q <return> to quit---
at /home/permal/electronics/IO-Card-G3/software/main/main.cpp:4
4 {
(gdb)
In VS Code, the following can be seen:
=thread-group-added,id="i1"
GNU gdb (Ubuntu 8.1-0ubuntu3) 8.1.0.20180409-git
Copyright (C) 2018 Free Software Foundation, Inc.
License GPLv3+: GNU GPL version 3 or later <http://gnu.org/licenses/gpl.html>
This is free software: you are free to change and redistribute it.
There is NO WARRANTY, to the extent permitted by law. Type "show copying"
and "show warranty" for details.
This GDB was configured as "x86_64-linux-gnu".
Type "show configuration" for configuration details.
For bug reporting instructions, please see:
<http://www.gnu.org/software/gdb/bugs/>.
Find the GDB manual and other documentation resources online at:
<http://www.gnu.org/software/gdb/documentation/>.
For help, type "help".
Type "apropos word" to search for commands related to "word".
Warning: Debuggee TargetArchitecture not detected, assuming x86_64.
=cmd-param-changed,param="pagination",value="off"
Stopped due to shared library event (no libraries added or removed)
Loaded '/lib64/ld-linux-x86-64.so.2'. Symbols loaded.
[Thread debugging using libthread_db enabled]
Using host libthread_db library "/lib/x86_64-linux-gnu/libthread_db.so.1".
Breakpoint 1, 0x00000000004660d0 in main ()
At this point, VS Code still seems to thing the app is running because it still has the pause-button enabled. So, how to get VS Code synced with gdb?

rubber_duck_
Posts: 1
Joined: Tue May 28, 2019 5:25 pm

Re: Debugging with VS Code?

Postby rubber_duck_ » Tue May 28, 2019 5:28 pm

I am using the following `launch.json` configuration and it is working for me on MacOS to step through the code, etc. I am, however, having issues with the same on windows.

Code: Select all

{
    // Use IntelliSense to learn about possible attributes.
    // Hover to view descriptions of existing attributes.
    // For more information, visit: https://go.microsoft.com/fwlink/?linkid=830387
    "version": "0.2.0",
    "configurations": [{
        "name": "OpenOCD Debug",
        "type": "cppdbg",
        "request": "launch",
        "miDebuggerPath": "xtensa-esp32-elf-gdb",
        "program": "${workspaceFolder}/build/test.elf",
        "setupCommands": [{
            "description": "enable pretty printing for gdb",
            "text": "-enable-pretty-printing",
            "ignoreFailures": true
        }, {
            "text": "file '${workspaceFolder}/build/test.elf'"
        }, {
            "text": "target remote :3333"
        }, {
            "text": "monitor program_esp32 ${workspaceFolder}/build/test 0x10000 verify"
        }, {
            "text": "monitor reset halt"
        }, {
            "text": "thb app_main"
        }],
        "cwd": "${workspaceFolder}",
        "externalConsole": true
    }]
}

oystein
Posts: 2
Joined: Tue Feb 23, 2016 8:08 am

Re: Debugging with VS Code?

Postby oystein » Thu Aug 22, 2019 3:05 pm

Thanks for including your tasks and launch scripts :)
I was finally able to debug ESP32 WROVER board with VS Code using WSL (Windows Subsystem for Linux).
To do so I followed these steps:
  1. Enable ESP32 environment on WSL: https://www.instructables.com/id/ESP32- ... for-Linux/
  2. Enable VS Code environment on WSL: https://code.visualstudio.com/docs/remote/wsl
  3. To generate compile_commands.json automatically. Install CompileDB:

    Code: Select all

    pip install compiledb
    . The "Make compile_commands.json" task will use this tool to fix intellisense include paths according to what is used in the project.
  4. Setup the Espressif toolchain on Windows too. OpenOCD has to be run from Windows since it cannot reach the USB from WSL. This is done automatically from the defined VS code task (it calls the exe file from WSL).
    • In explorer, enter: "\\wsl$". This shows the Ubuntu file share. You might have to uprgade Windows 10 to do this.
    • Right click and map "Ubuntu" to "U:". This lets you open your Unubtu files inside cmd.
    • Open cmd window and navigate to U:/home/.../esp-idf/
    • Run install.bat on Windows
  5. Follow these instructions for making OpenOCD work under Windows: https://docs.espressif.com/projects/esp ... rover.html
My tasks.json:

Code: Select all

{
    // See https://go.microsoft.com/fwlink/?LinkId=733558
    // for the documentation about the tasks.json format
    "version": "2.0.0",
    "tasks": [
        {
            "label": "Make project",
            "type": "shell",
            "command": "make all",
            "group": {
                "kind": "build",
                "isDefault": true
            },
            "problemMatcher": [
                "$gcc"
            ]
        },
        {
            "label": "openocd",
            "type": "shell",
            "isBackground": true,
            "options": {
                "cwd": "/mnt/c/Users/oyste/.espressif/tools/openocd-esp32/v0.10.0-esp32-20190708/openocd-esp32"
            },
            "command": "bin/openocd.exe -s share/openocd/scripts -f  interface/ftdi/esp32_devkitj_v1.cfg -f board/esp32-wrover.cfg",
        },
        {
            "label": "Make compile_commands.json",
            "type": "shell",
            "command": "compiledb make"
        }
    ]
}
My launch.json:

Code: Select all

{
    // Use IntelliSense to learn about possible attributes.
    // Hover to view descriptions of existing attributes.
    // For more information, visit: https://go.microsoft.com/fwlink/?linkid=830387
    "version": "0.2.0",
    "configurations": [
              {
                "type": "gdb",
                "request": "launch",
                "name": "Launch Program",
                "target": "./build/hello-world.elf",
                "cwd": "${workspaceFolder}",
                "gdbpath": "/home/oystein/esp/xtensa-esp32-elf/bin/xtensa-esp32-elf-gdb",
                "autorun": [
                  "target remote :3333",
                  "mon reset halt",
                  "flushregs",
                  "thb app_main",
                  "c"
                ],
                "preLaunchTask": "openocd"
              }
    ]
}
Some issues i experience:
  • Debugger does not detect chip reset. And does not trigger breakpoints after a chip reset (like in the hello-world app).
  • Debugging feels a little unstable. Maybe because of some of these limitations (ref Visual GDB): https://sysprogs.com/w/limitations-of-t ... debugging/
  • I have not got the serial output to appear automatically in the output window. Still running a separate shell window for that.
Maybe someone has ideas on how to overcome these issues using VS Code?

Best regards
Øystein Krag

CalinB
Posts: 15
Joined: Tue May 08, 2018 4:20 pm

Re: Debugging with VS Code?

Postby CalinB » Fri Aug 23, 2019 12:36 pm

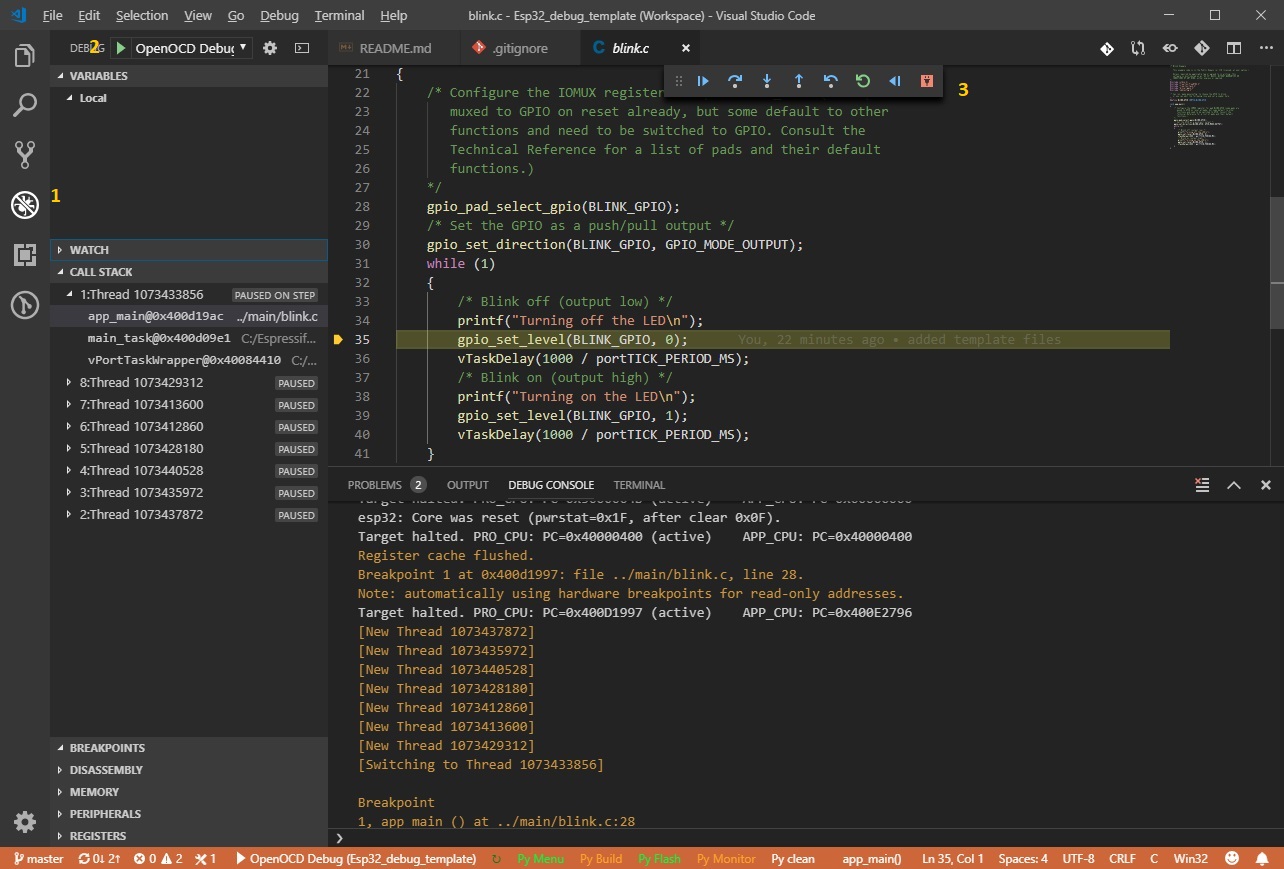
I made an ESP32 debug template project for VsCode that work's just fine: https://github.com/botofancalin/Esp32_debug_template

Image

You can use this template as a starting point for your project.

Please read the instructions to set up the environment properly.

oystein
Posts: 2
Joined: Tue Feb 23, 2016 8:08 am

Re: Debugging with VS Code?

Postby oystein » Tue Aug 27, 2019 7:55 am

Thanks, this was very helpful!
I had some trouble with the Ninja build environment.
It turned out that there was a conflict with Cygwin.
I disabled Cygwin in my PATH and that fixed the problem.

Who is online

Users browsing this forum: Majestic-12 [Bot] and 97 guests