
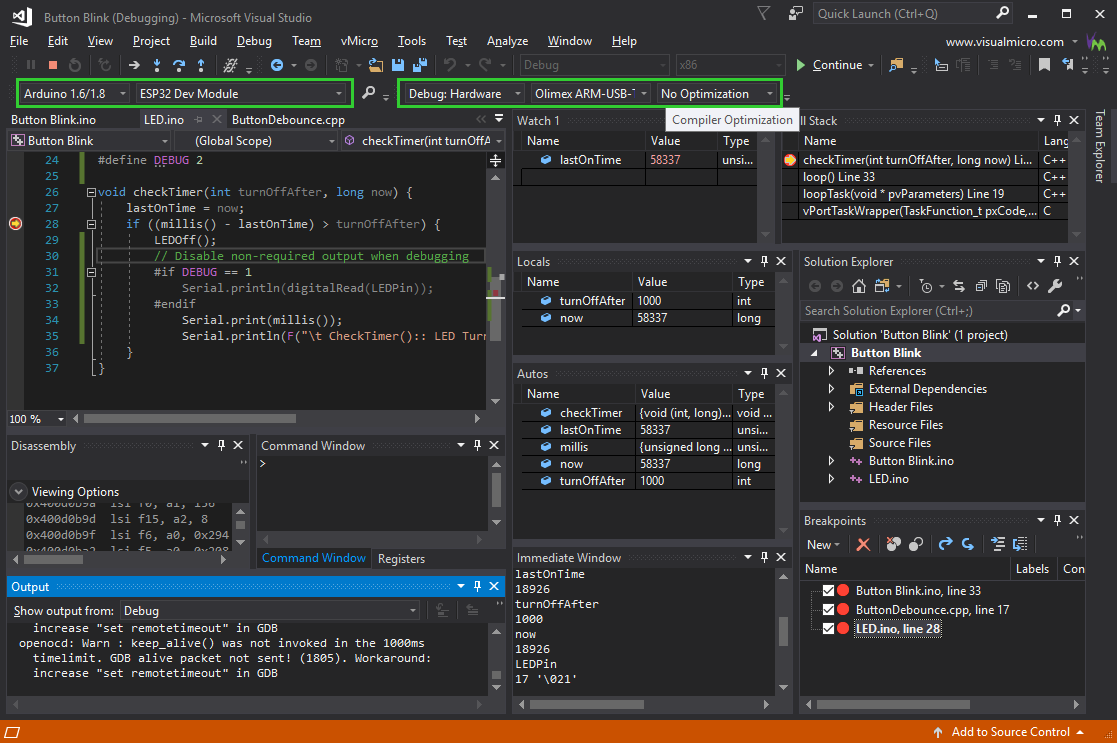
We have connected the ESP32 Arduino debugging to Visual Studio using the MI Debugger with GDB/OpenOCD, allowing the debugging to take place from the more familiar IDE surroundings, with all visual controls expected for step Into/Over/Out etc... available.
It has been made compatible with a variety of ESP32 compatible Debug/Programming boards already:
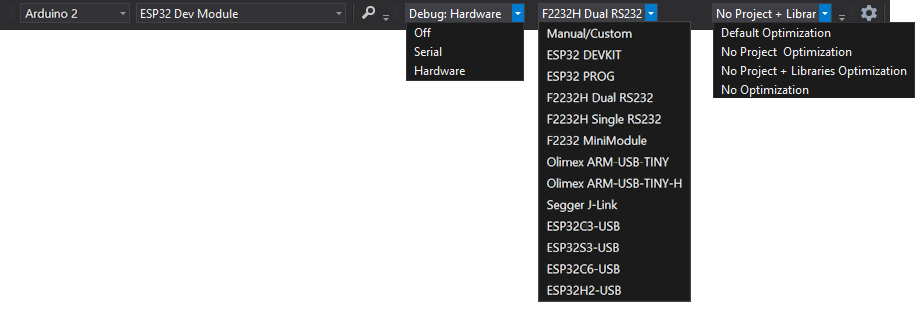
And can be easily extended using the standard debugger_launch.json to allow other Programmers and targets to be supported as well.
A Video of all of this working can be seen here on YouTube, and further information about setting this up is also available here.